Decoding Dollars: Your Simple Guide to Understanding Financial Statements
Hey there, future Warren Buffetts! Ever feel like financial statements are some kind of ancient scroll only decipherable by wizards in pinstripe suits? Yeah, me too. But guess what? Investing doesn't have to be intimidating, and understanding where your money is going (or, more importantly,couldbe going) is totally within your reach.
Think about it: you wouldn't buy a car without kicking the tires and checking under the hood, right? So why would you blindly throw your hard-earned cash into a company without understanding its financials? That's like driving with your eyes closed – a recipe for disaster! I remember once, back in the day when I was younger and maybe a little naive, I invested in a company simply because their commercials were funny. Turns out, their financials weren't so humorous. Let’s just say I learned a valuable lesson: laughter doesn't always translate to profit.
The problem is, financial statements often look like a jumbled mess of numbers and jargon. Assets, liabilities, equity…it's enough to make your head spin faster than a day trader on a caffeine bender. And let's be honest, most of us didn't major in accounting, so trying to make sense of it all can feel like trying to assemble IKEA furniture without the instructions. Frustrating, right? Absolutely!
But here's the good news: you don't need to be a financial whiz to understand the basics. This guide is designed to break down those complex financial statements into bite-sized pieces, so you can start making smarter investment decisions. We'll ditch the stuffy accounting terms and focus on what really matters: how to spot a healthy company and avoid potential pitfalls.
We're going to take you from financial statement newbie to confident investor, one simple step at a time. No complicated formulas, no confusing jargon, just plain English explanations that even your grandma could understand. And trust me, when you start understanding the story behind those numbers, investing becomes a whole lot less scary and a whole lot more rewarding. So, grab a cup of coffee (or maybe something a little stronger, depending on your current level of financial statement anxiety) and get ready to unlock the secrets of the balance sheet, income statement, and cash flow statement. Are you ready to turn those financial hieroglyphics into profitable insights?
A Beginner’s Guide to Reading Financial Statements for Investors
Diving into the Financial Depths: A Simplified Guide
So, you're ready to decode the mysteries of financial statements and make more informed investment choices. Excellent! Let's start by understanding the key documents you'll encounter. These aren't just random pages filled with numbers; they're a company's story told in financial terms. Think of them as the annual physical exam for a business – they reveal its overall health and potential for growth.
The Big Three: Income Statement, Balance Sheet, and Cash Flow Statement
These are the holy trinity of financial reporting. Each one provides a unique perspective on a company's performance, and understanding how they work together is crucial for making sound investment decisions.
• The Income Statement (or Profit and Loss Statement): What's the bottom line? This statement, often called the P&L, is like a snapshot of a company's performance over a specific period (usually a quarter or a year). It shows you how much revenue the company generated and how much it spent to generate that revenue, ultimately revealing its net income (or profit). Think of it as the company's report card for the period – did it make the grade? Here's what you'll typically find:
-Revenue: The total amount of money the company brought in from sales.
-Cost of Goods Sold (COGS): The direct costs associated with producing the goods or services sold.
-Gross Profit: Revenue minus COGS. This tells you how efficiently the company is producing its goods or services.
-Operating Expenses: Costs associated with running the business, such as salaries, rent, and marketing.
-Operating Income: Gross profit minus operating expenses. This is a key indicator of the company's core profitability.
-Net Income: The final profit after all expenses, including taxes and interest, are deducted. This is the "bottom line" that everyone focuses on.
Example: Imagine you're running a lemonade stand. Your revenue is the money you make from selling lemonade. Your COGS is the cost of lemons, sugar, and water. Your operating expenses include the cost of your stand and any advertising (like a hand-drawn sign). Your net income is what you have left after paying for everything.
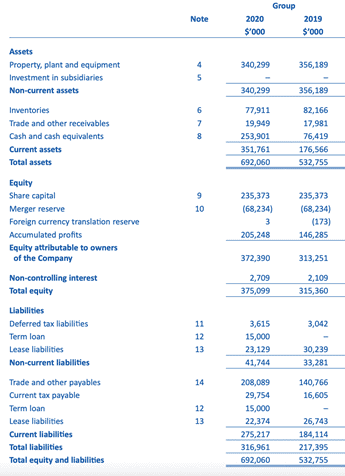
• The Balance Sheet: What does the company own and owe? This statement provides a snapshot of a company's assets, liabilities, and equity at a specific point in time. It's based on the fundamental accounting equation: Assets = Liabilities + Equity. Think of it as a financial photograph of the company's possessions and obligations.
-Assets: What the company owns. This includes things like cash, accounts receivable (money owed to the company), inventory, property, plant, and equipment (PP&E).
-Liabilities: What the company owes to others. This includes things like accounts payable (money the company owes to suppliers), salaries payable, and debt.
-Equity: The owners' stake in the company. This is the residual value of the assets after deducting liabilities. It represents the net worth of the company from the shareholders' perspective.
Example: Back to our lemonade stand. Your assets are your cash, your stand, and your remaining lemonade. Your liabilities are any money you owe to your parents for lending you the startup capital. Your equity is what's left over after you pay back your parents – your share of the lemonade empire!
• The Cash Flow Statement: Where did the money come from and where did it go? This statement tracks the movement of cash both into and out of a company over a period of time. It's divided into three sections:
-Operating Activities: Cash flow from the company's core business operations.
-Investing Activities: Cash flow from the purchase and sale of long-term assets, such as property, plant, and equipment.
-Financing Activities: Cash flow from debt, equity, and dividends.
Example: At the lemonade stand, operating activities include cash from selling lemonade and cash spent on supplies. Investing activities might involve buying a new, fancier stand. Financing activities could include borrowing money from your parents or paying them back.
Digging Deeper: Ratios and Metrics
Once you understand the basic financial statements, you can start using ratios and metrics to analyze a company's performance in more detail. These are like financial "vital signs" that can help you identify potential strengths and weaknesses.
• Profitability Ratios: Is the company making money efficiently? These ratios measure a company's ability to generate profits from its revenue. Some common profitability ratios include:
-Gross Profit Margin: (Gross Profit / Revenue) - This shows the percentage of revenue remaining after deducting the cost of goods sold.
-Operating Profit Margin: (Operating Income / Revenue) - This shows the percentage of revenue remaining after deducting operating expenses.
-Net Profit Margin: (Net Income / Revenue) - This shows the percentage of revenue remaining after deducting all expenses, including taxes and interest.
Example: A higher profit margin generally indicates a more efficient and profitable company. If your lemonade stand has a high profit margin, it means you're keeping a larger portion of each sale as profit.
• Liquidity Ratios: Can the company pay its bills? These ratios measure a company's ability to meet its short-term obligations. Some common liquidity ratios include:
-Current Ratio: (Current Assets / Current Liabilities) - This measures a company's ability to pay its current liabilities with its current assets. A ratio of 1 or higher is generally considered good.
-Quick Ratio: ((Current Assets - Inventory) / Current Liabilities) - This is a more conservative measure of liquidity that excludes inventory, which may not be easily converted to cash.
Example: If your lemonade stand has a high current ratio, it means you have enough cash and other liquid assets to cover your immediate debts, like paying for the lemons you bought on credit.
• Solvency Ratios: Can the company meet its long-term obligations? These ratios measure a company's ability to meet its long-term obligations, such as debt payments. A common solvency ratio is:
-Debt-to-Equity Ratio: (Total Debt / Total Equity) - This measures the amount of debt a company is using to finance its operations relative to its equity. A lower ratio generally indicates a more financially stable company.
Example: If your lemonade stand has a low debt-to-equity ratio, it means you're not relying heavily on debt to run your business, making you less vulnerable to financial difficulties.
• Efficiency Ratios: How well is the company managing its assets? These ratios measure how efficiently a company is using its assets to generate revenue. A common efficiency ratio is:
-Inventory Turnover Ratio: (Cost of Goods Sold / Average Inventory) - This measures how quickly a company is selling its inventory. A higher ratio generally indicates more efficient inventory management.
Example: If your lemonade stand has a high inventory turnover ratio, it means you're selling your lemonade quickly and not letting it sit around and spoil.
Putting It All Together: A Real-World Example
Let's imagine you're considering investing in "Super Snacks," a hypothetical company that makes healthy snack bars. After reviewing Super Snacks' financial statements, you notice the following:
-The income statement shows a steady increase in revenue over the past three years, but the net profit margin has been declining slightly.
-The balance sheet reveals a healthy amount of cash on hand, but also a significant increase in debt.
-The cash flow statement indicates strong cash flow from operations, but negative cash flow from investing activities, suggesting the company is investing heavily in new equipment.
Based on this information, you might conclude that Super Snacks is a growing company, but it's also taking on more debt and facing some challenges in maintaining its profitability. You might want to investigate further to understand why the net profit margin is declining and whether the company's investments in new equipment are likely to pay off in the future.
Remember, analyzing financial statements is not about finding a perfect company; it's about understanding the risks and rewards associated with investing in a particular business. By mastering the basics of financial statement analysis, you can make more informed decisions and increase your chances of achieving your investment goals. So go forth and conquer those financial statements – you've got this!
Beyond the Numbers: Qualitative Factors
While financial statements provide a quantitative view of a company's performance, it's crucial to remember that they don't tell the whole story. Qualitative factors, such as the company's management team, competitive landscape, and industry trends, can also have a significant impact on its future prospects. Think of it as adding color and context to the black-and-white picture painted by the numbers.
• Management Team: Are there experienced leaders at the helm? A strong and experienced management team can be a major asset for a company. Look for leaders with a proven track record of success and a clear vision for the future. Consider factors such as their experience in the industry, their leadership style, and their ability to attract and retain talented employees.
• Competitive Landscape: Does the company have a competitive advantage? Understanding a company's competitive landscape is essential for assessing its long-term potential. Consider factors such as the number of competitors, the barriers to entry, and the company's market share. Does the company have a unique product or service that gives it a competitive advantage? Does it operate in a growing market with strong demand?
• Industry Trends: Is the company riding a wave or swimming upstream? Staying abreast of industry trends can help you identify companies that are well-positioned for future growth. Are there any emerging technologies or changing consumer preferences that could impact the company's business? Is the industry experiencing rapid growth or facing headwinds?
• Brand Reputation: Is the company's image positive? A strong brand reputation can be a valuable asset for a company. Consider factors such as customer satisfaction, brand loyalty, and the company's social responsibility efforts. A positive brand reputation can help a company attract and retain customers, command premium prices, and weather economic downturns.
Risk Management: Protecting Your Investments
Investing always involves some level of risk, but understanding how to manage risk can help you protect your investments and achieve your financial goals. Diversification, due diligence, and staying informed are all important components of risk management.
• Diversification: Don't put all your eggs in one basket. Diversifying your investment portfolio across different asset classes, industries, and geographic regions can help reduce your overall risk. By spreading your investments, you can minimize the impact of any single investment performing poorly.
• Due Diligence: Do your homework before investing. Before investing in any company, it's important to do your own research and understand the risks involved. Review the company's financial statements, read industry reports, and talk to financial advisors. Don't rely solely on the recommendations of others – make your own informed decisions.
• Stay Informed: Keep up with the latest news and trends. The financial markets are constantly evolving, so it's important to stay informed about the latest news and trends. Follow reputable financial news sources, attend industry conferences, and monitor the performance of your investments regularly.
Financial Statements in Today's World
Financial statements have become more dynamic in today's fast-paced world, adapting to various business models and technological advancements. Understanding these changes is crucial for investors to stay ahead and make informed decisions. Let's explore some key aspects.
• Digital Business Models Understanding the key performance indicators (KPIs) that drive digital businesses is essential. These may include metrics like customer acquisition cost (CAC), customer lifetime value (CLTV), and monthly recurring revenue (MRR). This can help investors analyze the sustainability and growth potential of tech companies more accurately.
• Sustainability Reporting Many companies now include sustainability reports alongside their financial statements. These reports provide information on environmental, social, and governance (ESG) factors, which can be crucial for investors looking for ethical and responsible investments. Understanding how to interpret these reports can provide valuable insights into a company’s long-term sustainability and impact.
• Technological Advancements The use of artificial intelligence (AI) and machine learning (ML) in financial analysis is on the rise. Tools that can analyze financial statements and identify potential risks or opportunities are becoming more common. While these tools can be helpful, understanding the underlying data and assumptions remains essential for making sound investment decisions.
Practical Tips for Investors
Here are some practical tips to help you make the most out of financial statement analysis:
• Start Simple Begin with the basics and gradually increase your knowledge. Focus on understanding the key financial statements and ratios before delving into more complex analyses.
• Consistency is Key Review financial statements regularly and compare them over time. This will help you identify trends and potential issues.
• Use Multiple Sources Don’t rely solely on financial statements. Supplement your analysis with information from industry reports, news articles, and other sources.
• Seek Expert Advice If you’re unsure about something, don’t hesitate to seek advice from a financial advisor or accountant. They can provide personalized guidance based on your specific investment goals and risk tolerance.
Frequently Asked Questions
Let's tackle some common questions that often pop up when people are first learning to read financial statements:
• Question: What's the most important financial statement for a beginner to focus on?
Answer: The income statement is a great starting point. It provides a clear overview of a company's revenues, expenses, and profitability over a specific period. Understanding the income statement can help you quickly assess whether a company is generating profits and how efficiently it's managing its costs.
• Question: How often should I review a company's financial statements?
Answer: Ideally, you should review financial statements quarterly (every three months) and annually. Quarterly reports provide more frequent updates on a company's performance, while annual reports offer a comprehensive overview of the entire year.
• Question: What if I don't understand something in a financial statement?
Answer: Don't be afraid to ask for help! Consult with a financial advisor, accountant, or even a more experienced investor. There are also plenty of online resources available, such as tutorials, articles, and forums, that can help you understand complex financial concepts.
• Question: Can I rely solely on financial statements to make investment decisions?
Answer: No. While financial statements are a valuable tool, they shouldn't be the only factor you consider. You should also take into account qualitative factors, such as the company's management team, competitive landscape, and industry trends. A holistic approach to investing will lead to more informed and successful decisions.
Conclusion
Alright, friends, we've reached the end of our journey through the world of financial statements. You've now armed yourself with the knowledge to decode those seemingly complex documents and make more informed investment decisions. Remember, it's not about becoming an accounting wizard overnight; it's about understanding the basic principles and using them to your advantage.
We started by breaking down the "Big Three" financial statements – the income statement, balance sheet, and cash flow statement – and explored how they work together to paint a picture of a company's financial health. We then delved into key ratios and metrics that can help you analyze a company's profitability, liquidity, and solvency. And finally, we emphasized the importance of considering qualitative factors, such as the management team and competitive landscape, in addition to the numbers.
So, what's next? It's time to put your newfound knowledge into practice! Start by choosing a company you're interested in and analyzing its financial statements. Don't be afraid to make mistakes – that's how we learn. And remember, the more you practice, the more comfortable you'll become with financial statement analysis.
Ready to take the next step? I challenge you to pick a company you're curious about, download its latest annual report, and start digging into the numbers. Don't worry about understanding everything perfectly at first. Just focus on identifying the key trends and understanding the story that the financial statements are telling. Who knows, you might just uncover the next hidden gem in the stock market!
Remember, the world of investing can be daunting, but with the right tools and knowledge, you can navigate it with confidence. Keep learning, stay curious, and never stop asking questions. You have the potential to achieve your financial goals, and I'm here to support you every step of the way.
Now that you are equipped with the skills to read financial statements, what company will you analyze first?
