Understanding Volume Analysis in Bitcoin Trading: A Comprehensive Guide
If you're a trader or investor looking to understand the dynamics of the cryptocurrency market, particularly Bitcoin, then volume analysis is a tool you can't afford to ignore. While price movements often dominate the headlines, volume provides critical insights into the strength and sustainability of those moves. In this guide, we'll explore how volume analysis works, why it's essential for Bitcoin trading, and how you can use it to make more informed decisions.
What Is Volume Analysis?

At its core, volume analysis is the study of trading volume to gauge the strength of price trends. It helps traders determine whether a price movement is supported by strong buying or selling pressure. In the context of Bitcoin, volume refers to the total number of coins traded within a specific period—whether that’s a minute, an hour, a day, or longer.
Volume is one of the oldest and most reliable indicators used in financial markets. It acts as a "confirming" tool, helping traders validate price movements. For example, if Bitcoin’s price rises sharply but with low volume, it may signal a weak move that could reverse soon. Conversely, a strong price increase accompanied by high volume suggests a robust trend.
Why Volume Analysis Matters in Bitcoin Trading

Bitcoin, like any other asset, isn’t just about price—it's also about the forces driving that price. Volume analysis gives you a window into those forces. Here are a few reasons why it's so important:
- Confirming Trends: High volume during a price move indicates strong conviction among traders, making the trend more likely to continue.
- Identifying Reversals: Sudden drops in volume during a price rally can signal a potential reversal.
- Spotting Breakouts: Volume spikes often precede significant price breakouts, offering early signals for traders.
- Understanding Market Sentiment: Volume patterns can reveal whether retail investors or institutional players are dominating the market.
For instance, if you see a sharp rise in Bitcoin’s price alongside a surge in volume, it might indicate that large institutional investors are entering the market. On the flip side, a price drop with rising volume could suggest panic selling from retail traders.
Key Volume Patterns in Bitcoin Trading

There are several common volume patterns that traders look for when analyzing Bitcoin. Let’s break them down:
1. Volume Spikes
A volume spike occurs when trading volume surges far beyond the average. These often happen due to news events, regulatory changes, or major market developments. A spike can be a sign of either a strong bullish or bearish move, depending on the direction of the price.
Example: If Bitcoin’s price jumps after a major exchange announces support for BTC, and the volume doubles or triples, it’s a strong signal of market confidence.
2. Breakouts
A breakout happens when Bitcoin’s price moves above a key resistance level or below a key support level. Volume plays a crucial role here—strong breakouts typically come with increased volume, while weak ones may lack it.
Example: If Bitcoin breaks above $60,000 with a 50% increase in volume compared to the previous week, it's a strong indication that the upward trend is valid.
3. False Breakouts
Not all breakouts are genuine. A false breakout occurs when the price briefly moves past a key level but quickly reverses. These often happen with low volume, signaling a lack of conviction among traders.
Example: If Bitcoin rallies to $62,000 but fails to hold the level and crashes back down with minimal volume, it’s a red flag that the move was not sustainable.
4. Trending Stocks (and Crypto)
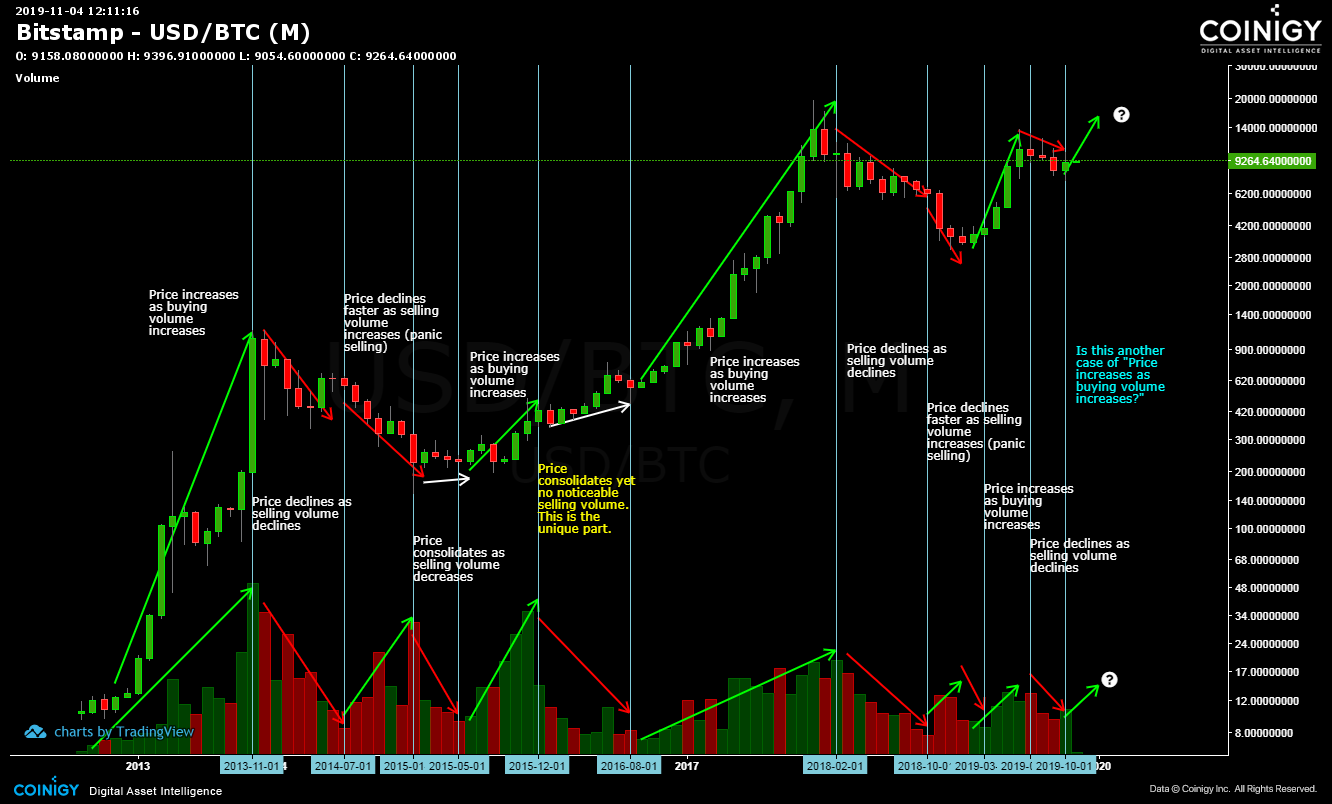
In a strong trend, volume should increase as the price moves higher (or lower). This pattern confirms that the trend is healthy and likely to continue.
Example: If Bitcoin consistently makes new highs with increasing volume, it’s a sign of a strong bull run. However, if the volume starts to decline, it could mean the trend is losing steam.
How to Apply Volume Analysis in Bitcoin Trading
Now that you understand the basics, let’s walk through some practical steps for applying volume analysis in your Bitcoin trading:
Step 1: Use Volume Indicators
Most trading platforms offer volume indicators that show the volume of trades over time. Look for tools that allow you to overlay volume on price charts. This helps you visually compare price movements with volume activity.
Step 2: Identify Key Levels
Look for areas where volume has historically been high. These levels often act as support or resistance. If Bitcoin breaks through a key resistance level with strong volume, it’s a solid signal to consider a long position.
Step 3: Watch for Divergences
Divergence occurs when the price and volume move in opposite directions. For example, if Bitcoin’s price is rising but volume is falling, it could indicate a weakening trend.
Step 4: Combine with Other Indicators
Volume analysis works best when combined with other technical indicators like moving averages, RSI, or Fibonacci retracements. This gives you a more complete picture of the market.
Advanced Volume Analysis Techniques

For experienced traders, there are more advanced techniques to refine your volume analysis:
- Volume Weighted Average Price (VWAP): This measures the average price at which a security has traded throughout the day, weighted by volume. It’s useful for identifying fair value and spotting potential entry points.
- Accumulation/Distribution Line: This indicator tracks the flow of money into or out of an asset based on volume and price. It helps identify whether buyers or sellers are in control.
- On-Balance Volume (OBV): OBV measures cumulative volume, assuming that volume flows into the market when the price rises and out when it falls. It can help confirm trends and spot potential reversals.
These tools add another layer of insight, allowing you to make more precise trading decisions.
Real-World Examples of Volume Analysis in Bitcoin
Let’s take a look at a real-world example to see how volume analysis can work in practice.
In 2021, Bitcoin surged to an all-time high of over $64,000. During this period, volume spiked significantly, especially in Japan, where it accounted for nearly 57% of global Bitcoin trading. This surge was driven largely by retail investors using leveraged accounts, indicating strong interest and participation.
However, as the market matured, volume began to shift. Institutional investors started playing a larger role, and the volume distribution became more balanced across different regions. This change in volume dynamics signaled a maturing market and a shift in sentiment.
Conclusion
Volume analysis is a powerful tool that every Bitcoin trader should master. It offers insights into market sentiment, trend strength, and potential reversals that can’t be gleaned from price alone. Whether you’re a beginner or an experienced trader, understanding how to read volume can significantly improve your trading outcomes.
By combining volume analysis with other technical indicators and staying attuned to market conditions, you’ll be better equipped to navigate the volatile world of Bitcoin trading. Remember, the goal isn’t just to follow the price—it’s to understand what’s driving it.
As the Bitcoin market continues to evolve, so too will the importance of volume analysis. Stay informed, stay disciplined, and let volume be your guide.
