How to Trade Bitcoin Using Technical Indicators: A Complete Guide
Bitcoin’s price is notoriously volatile, making it both a thrilling and challenging asset to trade. For traders looking to navigate this unpredictable market, technical indicators can be invaluable tools. These metrics help identify trends, spot potential entry and exit points, and manage risk more effectively. In this guide, we’ll explore the most effective technical indicators for trading Bitcoin, how they work, and how you can use them to improve your trading strategy.

Understanding Technical Indicators

Technical indicators are mathematical calculations based on historical price and volume data. They help traders interpret market conditions and make informed decisions. While no indicator is foolproof, combining several can provide a more comprehensive view of the market. Here are some of the most commonly used technical indicators in Bitcoin trading:
1. Relative Strength Index (RSI)
The RSI is one of the most popular indicators for identifying overbought and oversold conditions. It measures the speed and change of price movements, typically on a scale from 0 to 100.
- Overbought: When the RSI exceeds 70, it suggests the asset may be overbought and due for a correction.
- Oversold: When the RSI falls below 30, it indicates the asset may be oversold and could see a price rebound.
For example, if Bitcoin’s RSI hits 75, it might signal that the price has risen too quickly and could soon pull back. Conversely, an RSI of 25 could suggest a buying opportunity.
2. Moving Averages

Moving averages smooth out price data to create a clearer trend line. There are two main types: simple moving averages (SMA) and exponential moving averages (EMA).
- Short-Term MA (e.g., 50-day): Helps identify short-term trends.
- Long-Term MA (e.g., 200-day): Indicates long-term trends.
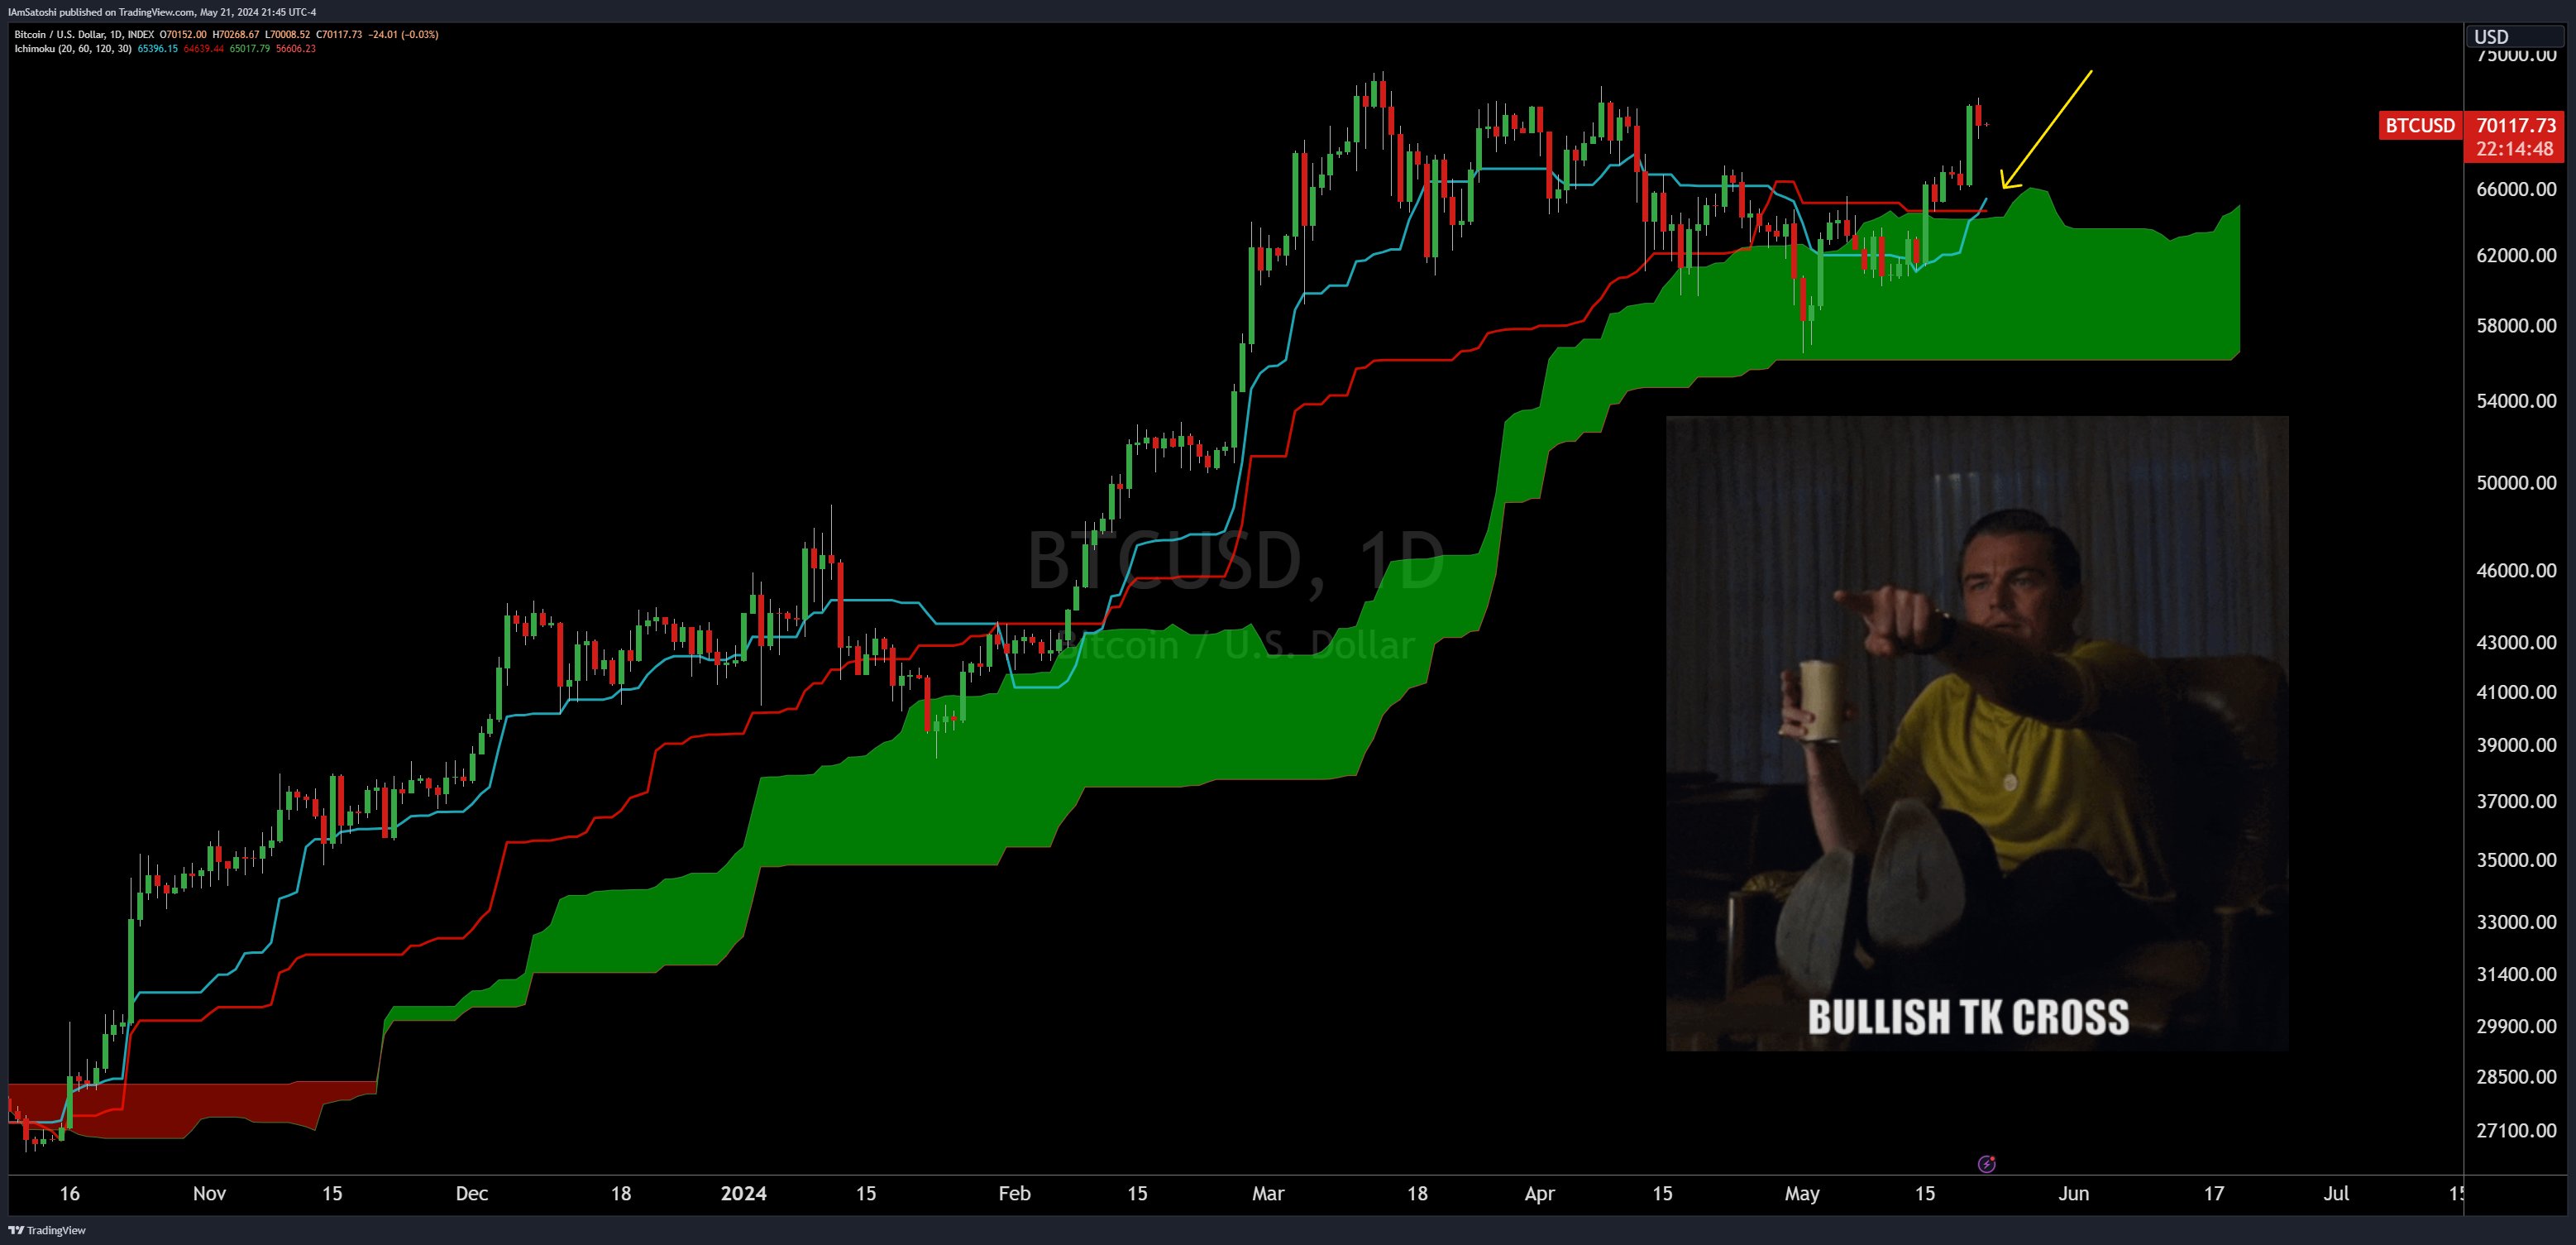
When the short-term MA crosses above the long-term MA, it's often seen as a bullish signal (a "golden cross"). Conversely, when the short-term MA crosses below the long-term MA, it's a bearish signal (a "death cross").
3. Fibonacci Retracement

Fibonacci retracement levels are horizontal lines that indicate where the price might find support or resistance after a significant price move. The key levels are 23.6%, 38.2%, 50%, 61.8%, and 78.6%.
Traders use these levels to anticipate where the price might reverse or continue its trend. For instance, if Bitcoin drops from $70,000 to $50,000, the Fibonacci retracement levels can help identify potential areas where the price might bounce back.
4. Volume Indicators

Volume is a crucial factor in confirming price movements. High volume during a price increase suggests strong buying pressure, while high volume during a price decline indicates strong selling pressure.
Traders often use volume indicators like the On-Balance Volume (OBV) to gauge the strength of a trend. If the OBV is rising along with the price, it confirms a bullish trend. If the OBV is falling while the price is rising, it could signal a potential reversal.
5. Bollinger Bands
Bollinger Bands consist of a moving average and two standard deviation bands. They help traders identify periods of high or low volatility.
- Narrow Bands: Suggest low volatility.
- Wide Bands: Suggest high volatility.
When the price touches the upper band, it may be overbought, and when it touches the lower band, it may be oversold. Traders often look for price reversals when the bands contract and then expand again.
Advanced Bitcoin Indicators
While the above indicators are widely used, there are also more advanced tools that can offer deeper insights into Bitcoin’s market behavior.
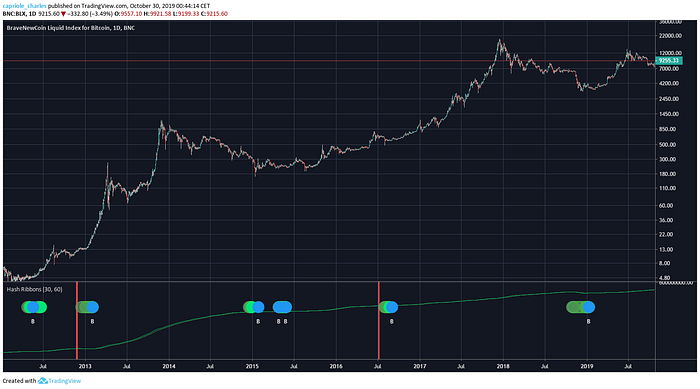
1. Hash Ribbons
Developed by Charles Edwards, the Hash Ribbons indicator uses the 30-day and 60-day Simple Moving Averages (SMAs) of Bitcoin’s hash rate. A crossover of the 30-day SMA above the 60-day SMA is considered a bullish signal, indicating the end of miner capitulation and the start of a recovery.
This indicator has been particularly useful around Bitcoin halving events, where the block reward is reduced, leading to increased scarcity and potential price increases.
2. MVRV Z-Score

The MVRV Z-Score compares Bitcoin’s market value to its realized value, helping traders determine whether Bitcoin is overvalued or undervalued.
- Overvalued: If the score exceeds 6.9, Bitcoin may be overvalued.
- Undervalued: If the score dips below 0.1, Bitcoin may be undervalued.
This indicator is especially useful for identifying potential market corrections or buying opportunities.
3. Pi Cycle Top Indicator

The Pi Cycle Top Indicator, developed by Philip Swift, is known for predicting major market tops. It triggers a "top signal" when the 111-day moving average crosses above twice the value of the 350-day moving average.
This indicator has historically signaled significant price drops, making it a valuable tool for traders looking to exit positions before a potential downturn.
Practical Tips for Using Bitcoin Indicators

- Combine Multiple Indicators: No single indicator is perfect. Use a combination of indicators to confirm signals and reduce the risk of false positives.
- Backtest Your Strategy: Before applying any indicator in live trading, test it on historical data to see how it performs under different market conditions.
- Understand Market Context: Indicators should be used in conjunction with broader market analysis, including news, regulatory changes, and macroeconomic factors.
- Set Clear Entry and Exit Points: Define your trading rules in advance to avoid emotional decisions during volatile market conditions.
- Monitor Risk Management: Always use stop-loss orders to limit potential losses, especially in highly volatile markets like Bitcoin.
Conclusion
Trading Bitcoin using technical indicators can significantly enhance your ability to navigate the cryptocurrency market. By understanding and applying the right tools, you can make more informed decisions, manage risk effectively, and potentially improve your trading outcomes. Whether you're a beginner or an experienced trader, mastering these indicators is a crucial step toward building a successful Bitcoin trading strategy.
Remember, while indicators can provide valuable insights, they are not infallible. Always stay informed, remain adaptable, and continuously refine your approach based on market conditions and personal goals. With the right knowledge and discipline, you can harness the power of technical indicators to achieve greater success in your Bitcoin trading journey.
