Understanding Support and Resistance in Bitcoin: A Key Trading Concept
Bitcoin, the world’s most prominent cryptocurrency, is a volatile asset that can swing dramatically in value within short periods. For traders and investors, understanding the dynamics of price movement is crucial. Two of the most fundamental concepts in technical analysis are support and resistance. These levels act as psychological markers on a price chart, indicating where buyers or sellers may step in to influence the market. In this article, we’ll explore what support and resistance mean in the context of Bitcoin, how to identify them, and why they matter for your trading strategy.
What Are Support and Resistance Levels?

In the world of crypto trading, support refers to a price level where an asset is unlikely to fall below due to strong buying interest. It acts as a "floor" that prevents further declines. Conversely, resistance is a price ceiling where selling pressure tends to halt upward momentum, acting as a "ceiling" that stops prices from rising higher.
Think of support and resistance as the tug-of-war between greed and fear in the market. When buyers dominate, the price moves up, hitting resistance. When sellers take control, the price drops, finding support.
For example, if Bitcoin has repeatedly bounced off $98,000, that level becomes a key support zone. If it fails to break above $105,000 multiple times, that becomes a critical resistance level.
How to Identify Support and Resistance in Bitcoin
There are several methods to spot these critical levels:
1. Round Numbers
Traders often pay attention to round numbers like $98,000, $100,000, or $105,000. These levels tend to attract attention because they are easy to remember and often serve as psychological milestones. If Bitcoin has historically found support at $98,000, that could be a key area to watch.
2. Peaks and Troughs
Look at historical price highs (peaks) and lows (troughs). If Bitcoin has bounced off a certain level multiple times, it likely holds significance. For instance, if the price dropped to $98,000 in June and then again in November, that level is a strong support.
3. Moving Averages
Moving averages, such as the 50-day or 200-day simple moving average (SMA), can act as dynamic support or resistance. If the price consistently bounces off a moving average, it may indicate a strong level.
4. Trendlines
Drawing trendlines by connecting price points over time helps visualize potential support and resistance. An upward-sloping trendline represents support, while a downward-sloping one represents resistance.
5. Pivot Points
Pivot points are calculated using the high, low, and close prices of a given period. They help identify key levels where the price might reverse. The formula for the pivot point is:
Pivot Point (PP) = (High + Low + Close) / 3
From there, you can calculate first, second, and third support and resistance levels.
Practical Strategies for Using Support and Resistance

Once you’ve identified key support and resistance levels, you can use them to make informed trading decisions.
1. Buy Near Support
If Bitcoin is approaching a known support level, it may be a good opportunity to buy. Traders often look for confirmation that the price is bouncing off the support before entering a long position.
2. Sell Near Resistance
When the price approaches a resistance level, it may be a good time to sell. If the price fails to break through, it could signal a potential reversal.
3. Use Stop-Loss and Take-Profit Orders
Place a stop-loss order just below a support level to limit losses if the price breaks through. Similarly, set a take-profit order just below a resistance level to lock in gains.
4. Breakout Trading
If the price breaks through a key resistance level, it could signal a bullish move. Conversely, a breakdown below support may indicate a bearish trend.
What Happens When Support Becomes Resistance?
One of the most interesting phenomena in technical analysis is when a support level turns into resistance. This occurs when the price breaks below a key support level, causing the former floor to become a ceiling.
For example, if Bitcoin has been bouncing off $98,000 for months, but suddenly falls below that level, the $98,000 mark may now act as resistance. This shift can create new opportunities for traders, as the price may test the old support level again from the upside.
Similarly, if the price breaks above a resistance level, that level can become a new support zone.
Popular Tools for Identifying Support and Resistance
Several tools can help you identify these levels more efficiently:
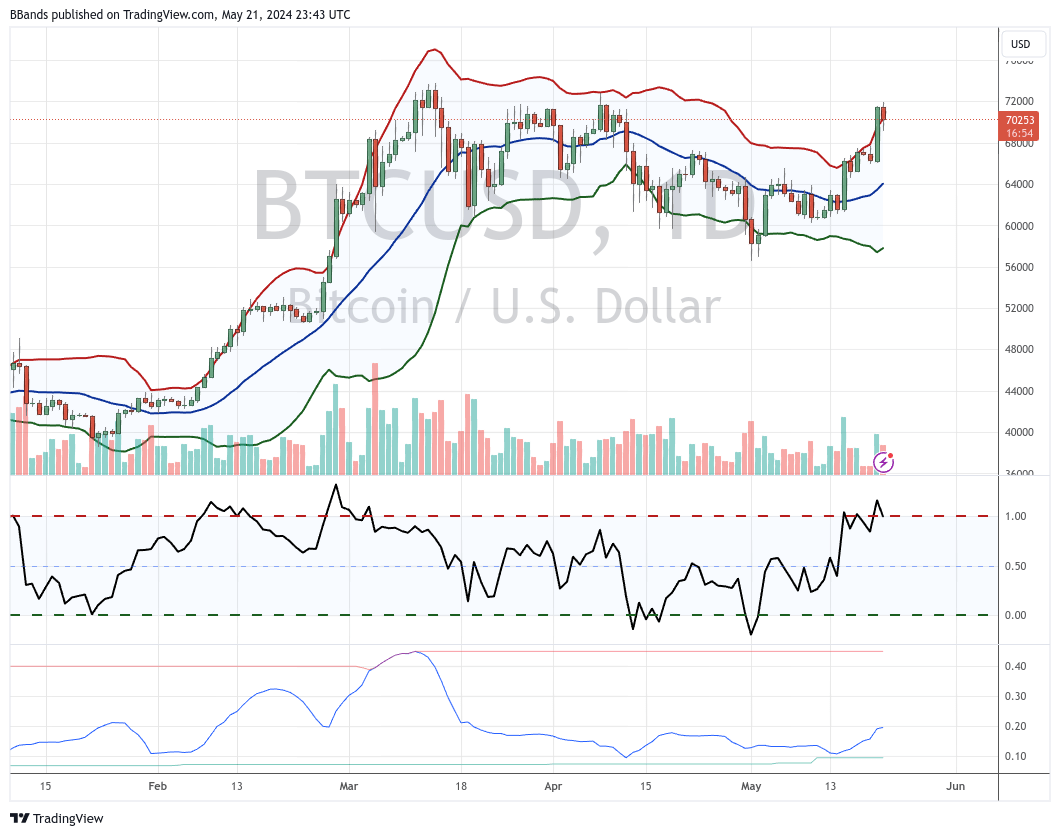
- Bollinger Bands: These consist of a moving average and two standard deviation lines that show volatility and potential support/resistance zones.
- Fibonacci Retracement: This tool uses key Fibonacci ratios to identify potential support and resistance levels based on previous price swings.
- TradingView: A powerful platform with customizable charts and built-in indicators for analyzing support and resistance.
- Bitsgap: Combines automation with advanced charting tools to help traders track and react to key levels in real-time.
Support and Resistance vs. Supply and Demand
While support and resistance are based on price levels, supply and demand refer to the broader market forces that drive price action. When demand exceeds supply, prices rise; when supply exceeds demand, prices fall.
Support and resistance levels are essentially the result of supply and demand dynamics. A strong support level indicates that demand is strong enough to prevent further price declines, while a strong resistance level suggests that supply is overwhelming buyers.
Conclusion
Understanding support and resistance is essential for any trader looking to navigate the volatile world of Bitcoin. These levels provide valuable insights into market psychology and can help you make more informed trading decisions.
Whether you're a beginner or an experienced trader, learning to identify and use support and resistance levels can significantly improve your chances of success. By combining these concepts with other technical indicators and risk management strategies, you can develop a robust trading plan that adapts to changing market conditions.
Remember, no single indicator or strategy guarantees success, but mastering the basics of support and resistance is a critical step toward becoming a more confident and effective trader.
