Understanding Volume Analysis in Bitcoin Price Movements
In the fast-paced world of cryptocurrency, understanding the factors that influence Bitcoin's price is crucial for investors and traders alike. One of the most powerful tools in this arsenal is volume analysis—a method used to gauge market sentiment and predict future price movements by examining trading volume. This article will delve into the intricacies of volume analysis as it relates to Bitcoin, providing you with actionable insights and a deeper understanding of how this technique can be leveraged effectively.

What Is Volume Analysis?
Volume analysis involves studying the number of trades or the amount of Bitcoin being traded over a specific period. It helps traders determine whether a price movement is supported by strong buying or selling pressure. High volume during a price increase suggests strong demand, while high volume during a price drop indicates significant selling pressure.
For instance, if Bitcoin’s price rises sharply on high volume, it often signals that buyers are aggressively purchasing the asset, which could lead to further gains. Conversely, a sharp decline on high volume may indicate panic selling, potentially leading to a more extended downturn.
The Role of Volume in Market Sentiment

Volume is not just about numbers; it reflects the emotional state of the market. When traders are confident, they tend to trade more, increasing volume. On the other hand, uncertainty or fear can lead to lower trading volumes.
Consider the following scenarios:
- Bullish Trend: A consistent rise in price accompanied by increasing volume often signals a strong bullish trend. This is a positive sign for long-term investors.
- Bearish Trend: A declining price paired with rising volume may indicate a bearish trend, suggesting that sellers are gaining control.
Understanding these dynamics can help traders make informed decisions and avoid entering the market at the wrong time.
Volume Delta Bias in Bitcoin Futures
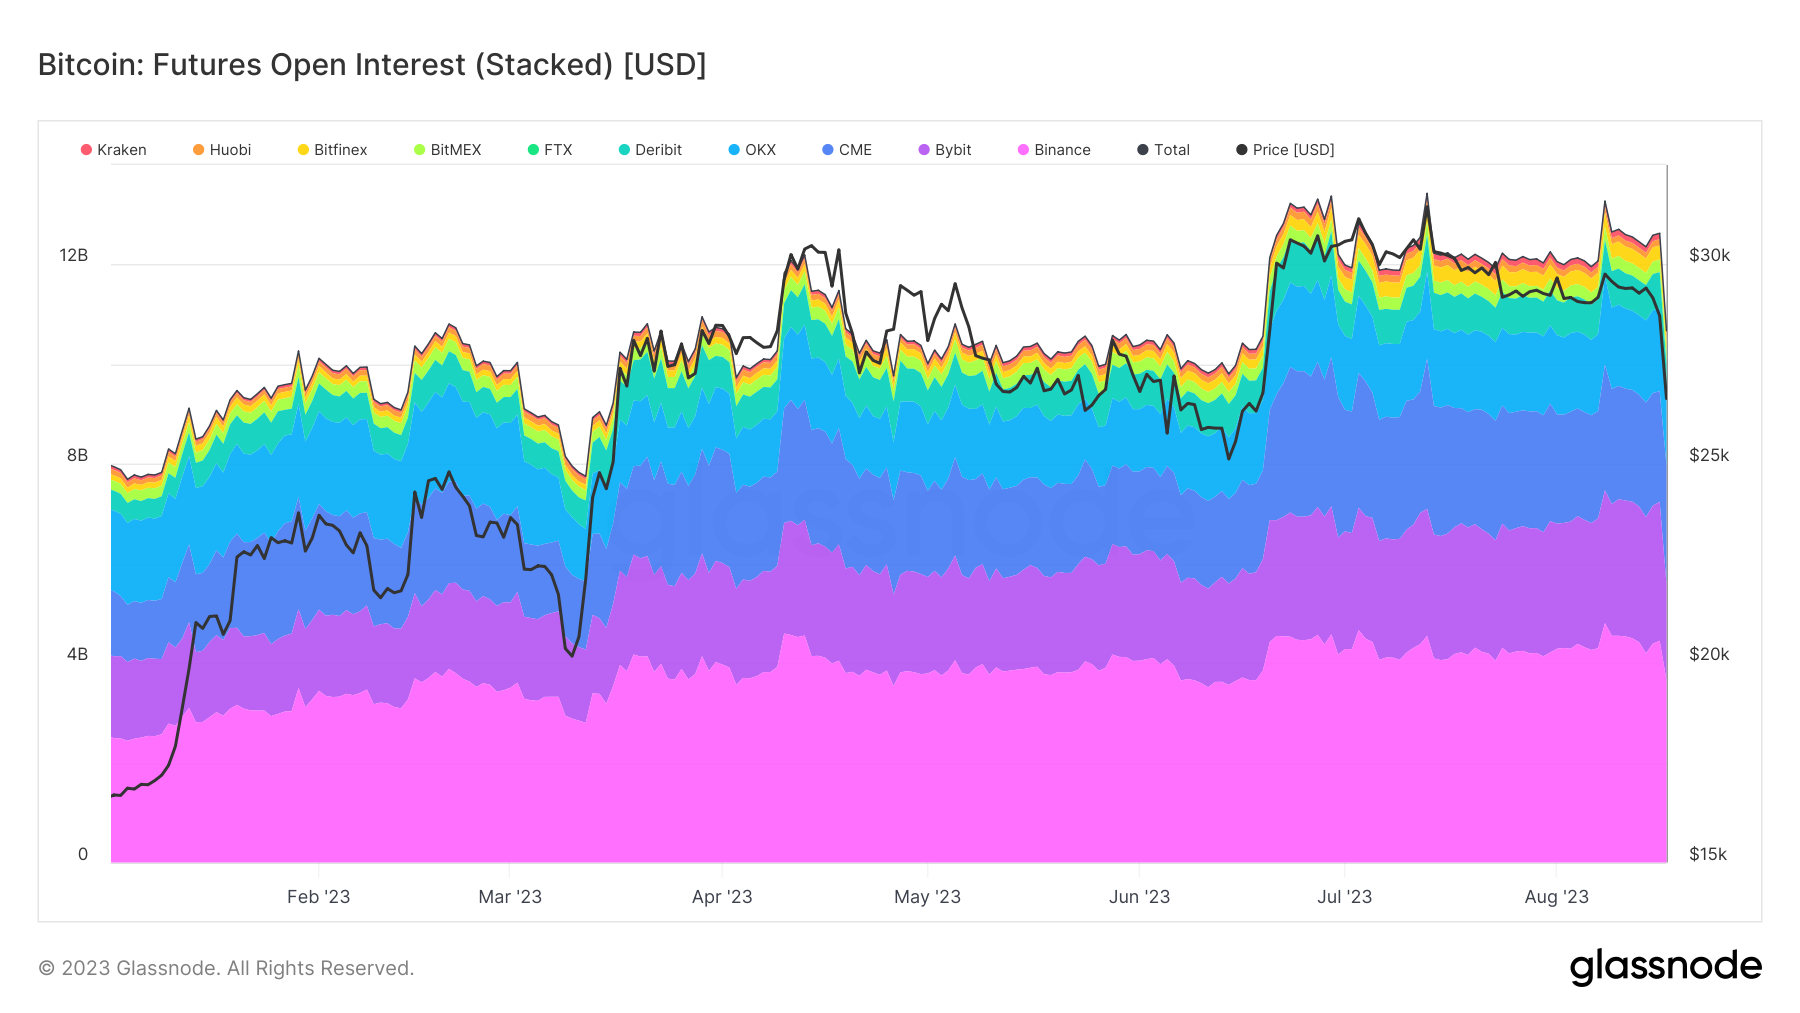
One of the more advanced concepts in volume analysis is Volume Delta Bias (CVD Bias), particularly in the context of Bitcoin futures. This metric compares the volume of buy and sell orders, offering insight into the market's direction.
According to recent data from 2024 to 2025, the CVD bias has shown a clear correlation with Bitcoin's price movements. When the CVD bias increases, it typically precedes a rise in Bitcoin's price, and vice versa. This makes it an essential tool for traders looking to anticipate market shifts.
Key points to consider:
- Imbalance in Order Book: Peaks in volatility often occur when there is an imbalance in the order book, indicating potential for significant price changes.
- Early Signal: CVD bias can act as an early indicator of price changes, allowing traders to adjust their strategies accordingly.
Practical Applications of Volume Analysis

Applying volume analysis in real-world scenarios requires a combination of technical skills and market awareness. Here are some practical tips for using volume analysis effectively:
- Identify Key Support and Resistance Levels: Use volume to confirm breakouts or breakdowns at key levels. High volume during a breakout can signal a strong move in the direction of the breakout.
- Watch for Divergences: If the price is moving in one direction but volume is moving in the opposite, it may indicate a potential reversal.
- Use Volume Indicators: Tools like the On-Balance Volume (OBV) and Volume Weighted Average Price (VWAP) can provide additional insights into market trends.
By integrating these strategies, traders can enhance their ability to interpret market movements and make more informed decisions.
Case Studies and Real-World Examples
To illustrate the effectiveness of volume analysis, let's look at a few real-world examples:
- 2021 Bull Run: During the 2021 bull run, Bitcoin saw significant price increases accompanied by surging trading volumes. This indicated strong institutional interest and retail investor enthusiasm.
- 2022 Bear Market: In contrast, the 2022 bear market was marked by declining prices and erratic volume patterns. Traders who recognized the volume divergence early were able to mitigate losses.
These examples highlight how volume analysis can be a valuable tool in navigating the volatile crypto market.
Conclusion
In conclusion, volume analysis is a critical component of understanding Bitcoin price movements. By examining trading volume, traders can gain insights into market sentiment, identify potential trends, and make more informed decisions. Whether you're a seasoned investor or a newcomer to the crypto space, mastering volume analysis can significantly enhance your trading strategy.
As the cryptocurrency market continues to evolve, staying informed and adaptable is key. By leveraging tools like Volume Delta Bias and other volume indicators, you can stay ahead of the curve and navigate the complexities of Bitcoin trading with confidence. Remember, the goal is not just to follow the market but to understand it deeply and act wisely.
